What is DockStats?
DockStats is a lightweight monitoring platform for developers running Docker in production. It lets you collect logs and system metrics from all containers across all hosts with a single agent. Just run our agent on your server — everything is automatically gathered and sent to your centralized DockStats dashboard.
Available Features
- Automatic collection of logs from all Docker containers across all hosts
- Aggregate logs from all Docker containers
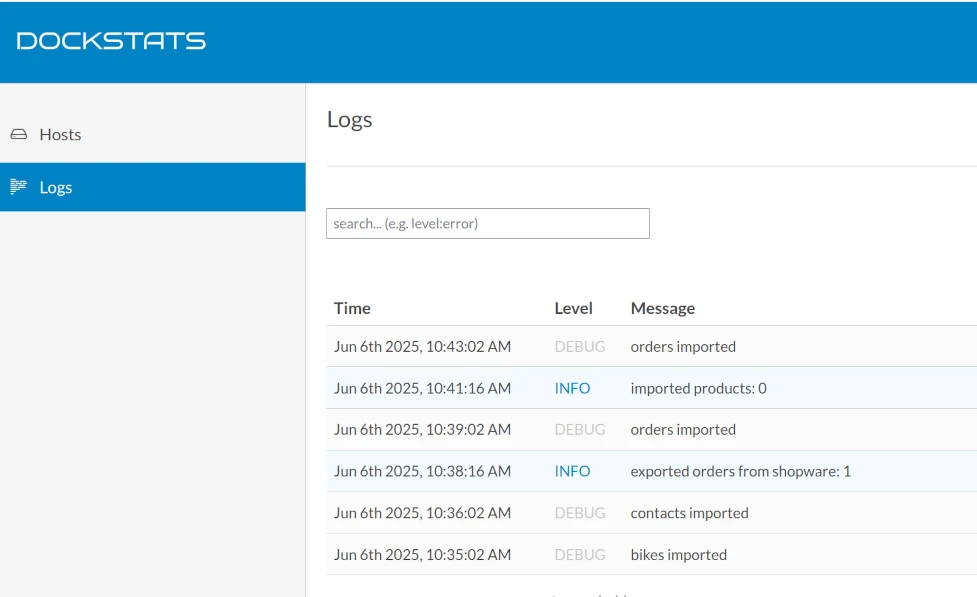
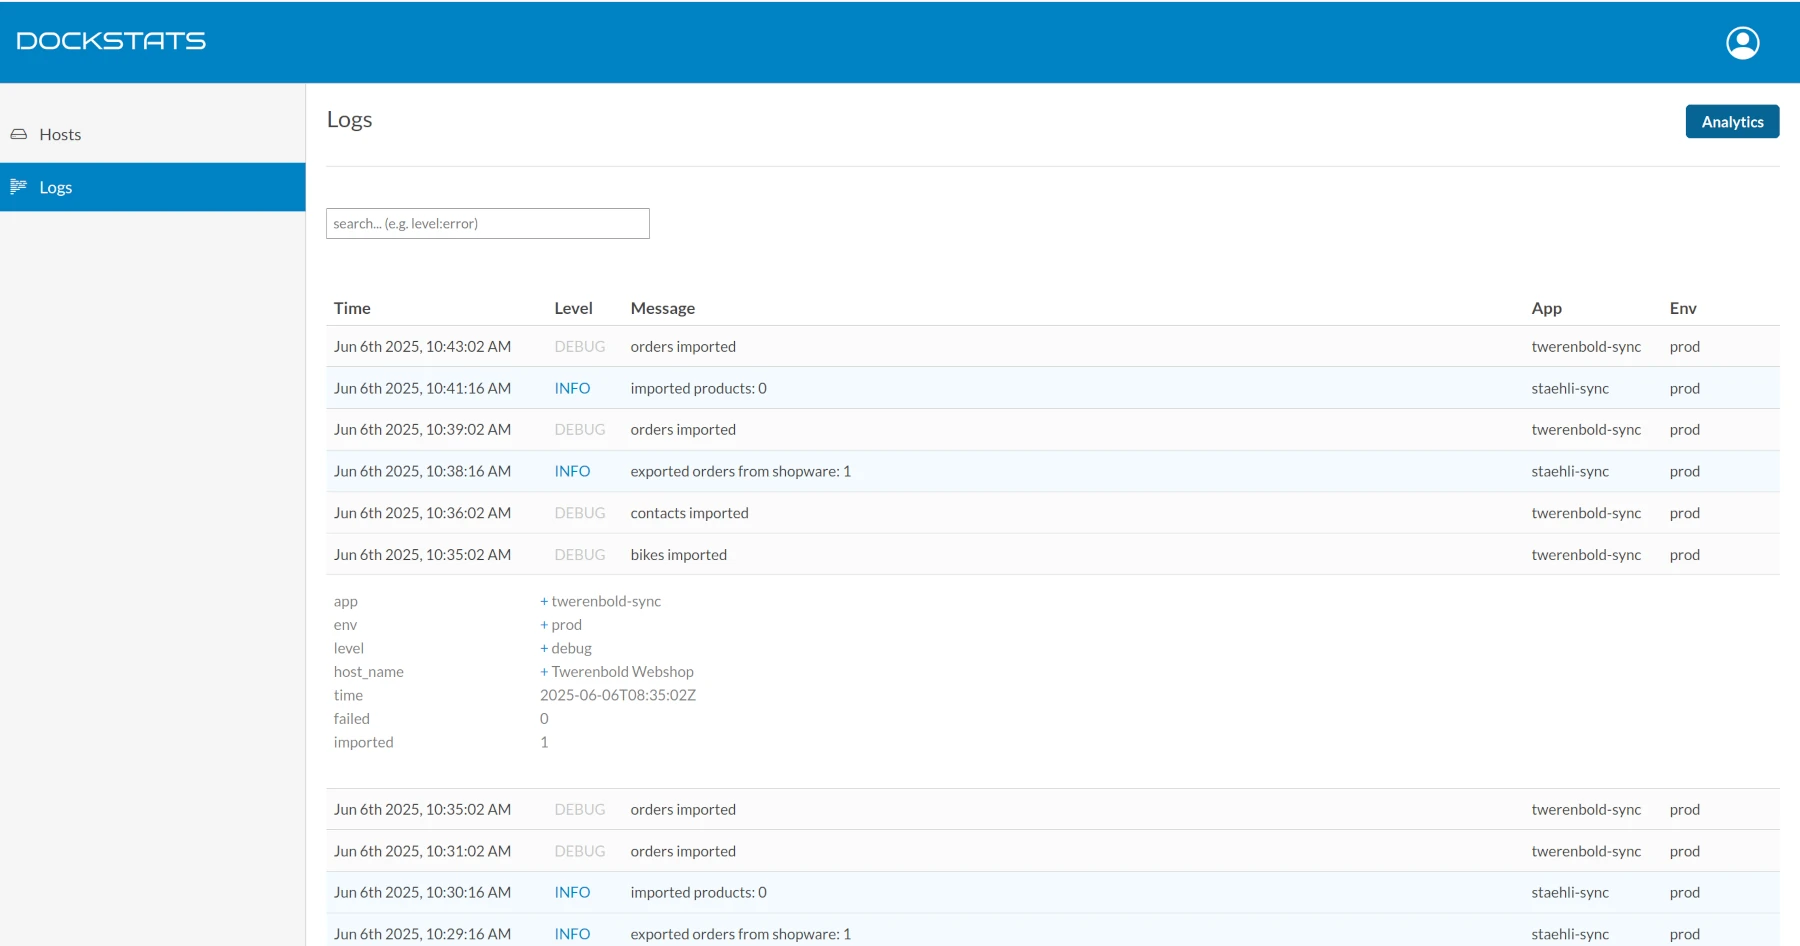
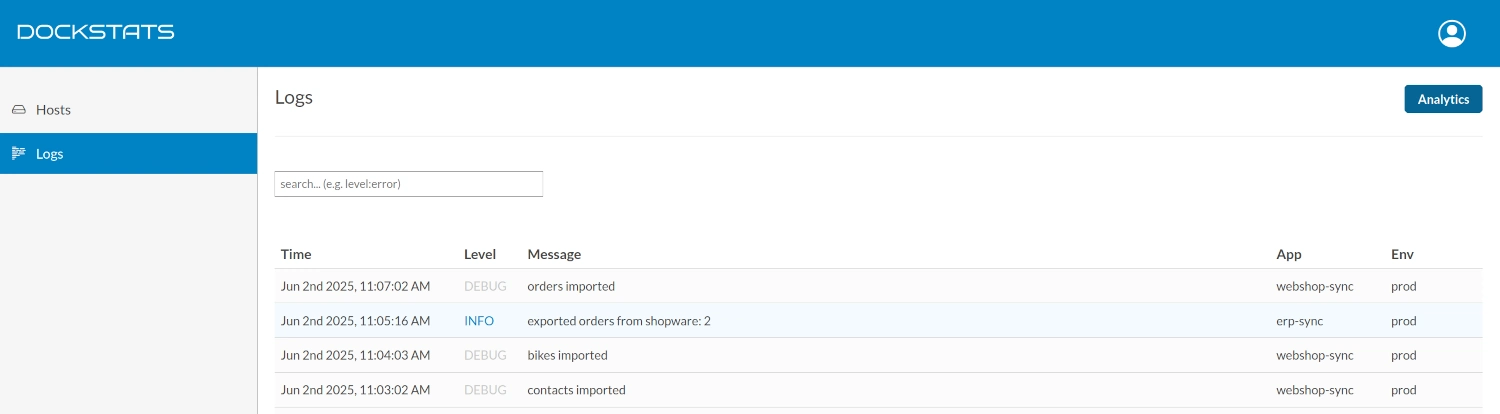
- Log classification by level, application, and environment
- Filtering logs using the above classifications
- Filtering logs by message content
- Capturing custom fields in structured logs
- Basic Log analytics
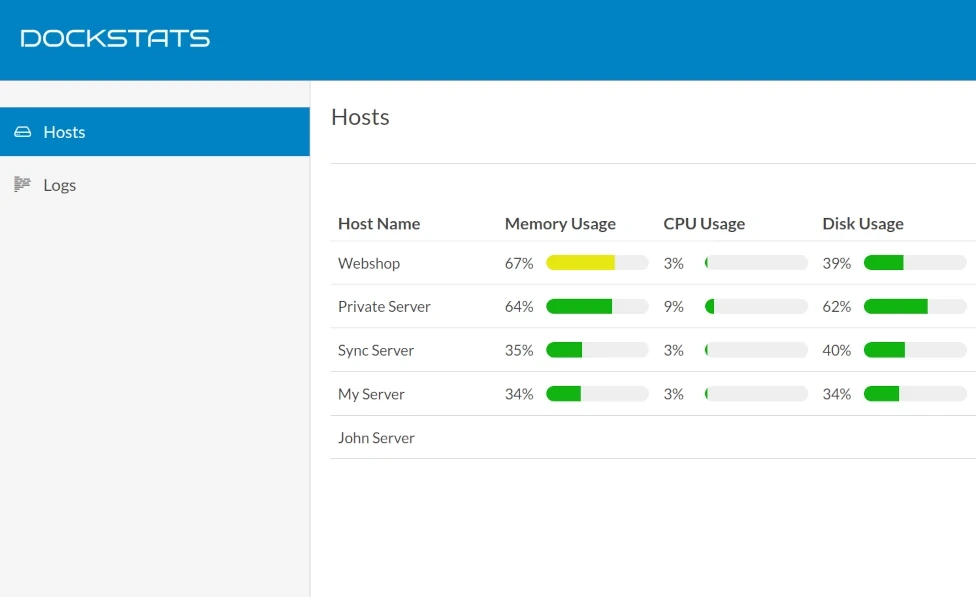
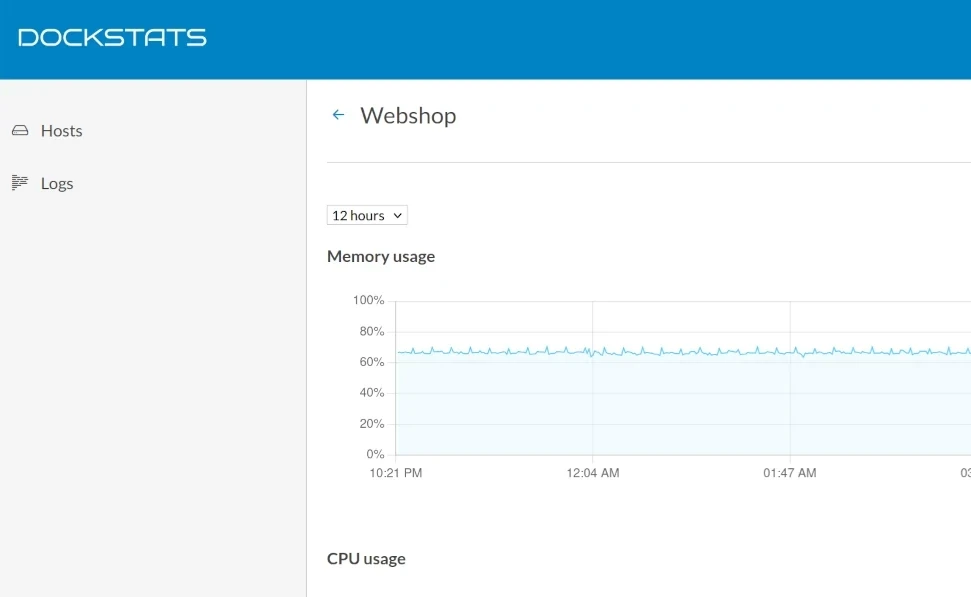
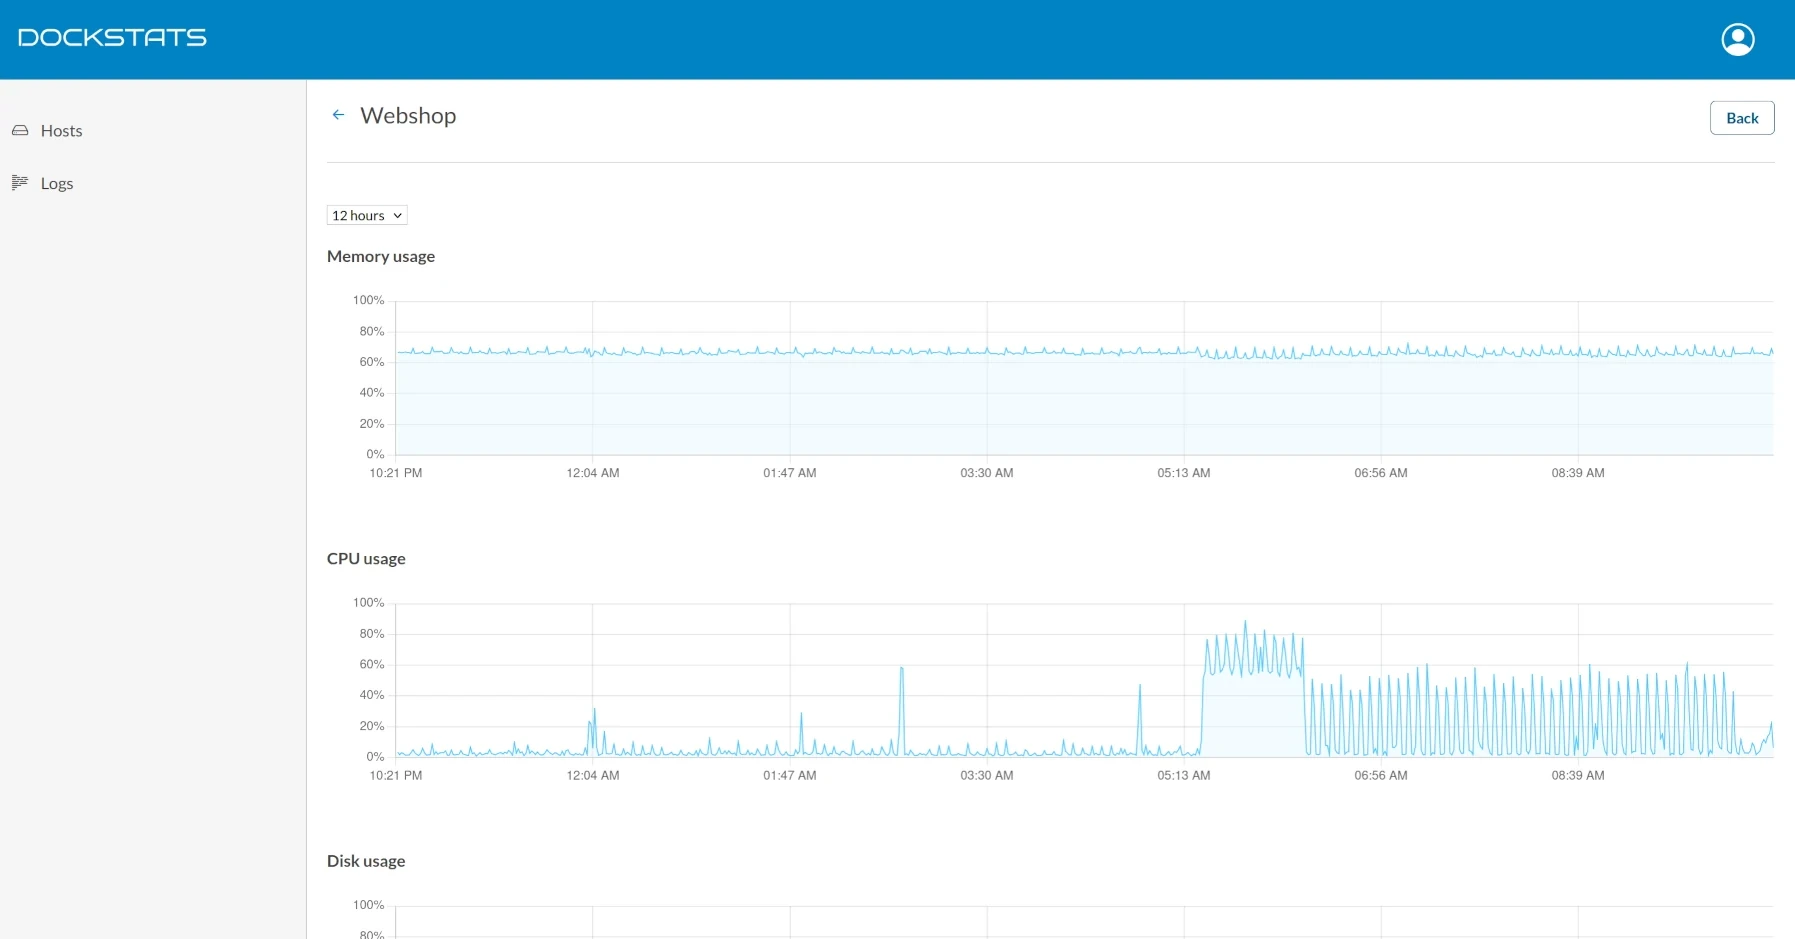
- Host monitoring (CPU, memory, etc.)
- Per-container monitoring across all hosts (CPU, memory)
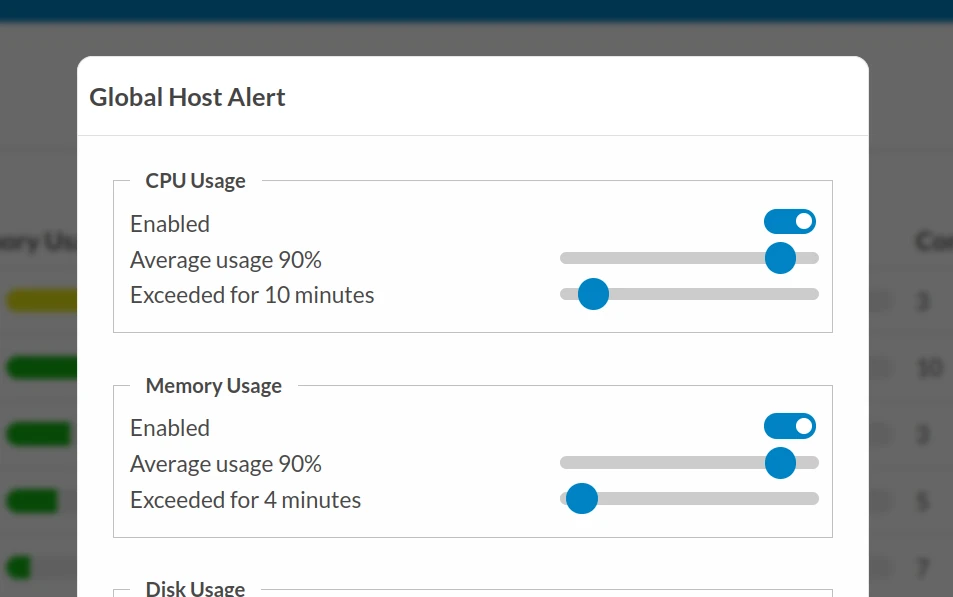
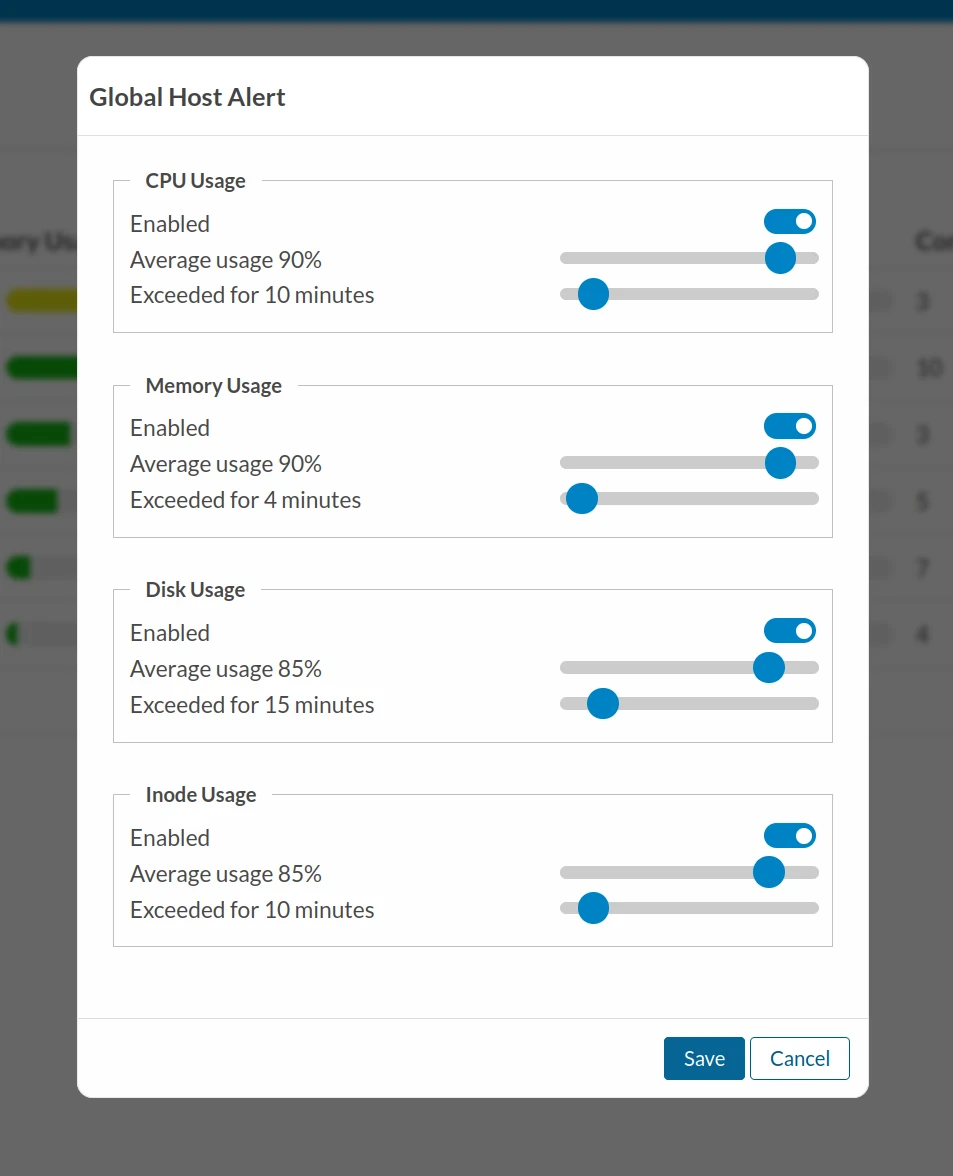
- Resource usage alerts (CPU, memory, etc.)
Roadmap (Coming Soon)
- Improved log search capabilities
- Log-based alerting
- Advanced Log analytics
- Uptime monitoring and checks (containers, domain, TLS, etc)
- Docker Swarm support
- Additional features are being developed based on user requests
Architecture
DockStats Hub
The central system that receives and displays all collected metrics and logs. It acts as your unified interface for observability across your entire infrastructure.
DockStats Agent
A lightweight collector you run on each of your Docker hosts. It automatically detects all containers, gathers logs and system metrics, and securely sends the data to the DockStats Hub.
How It Works
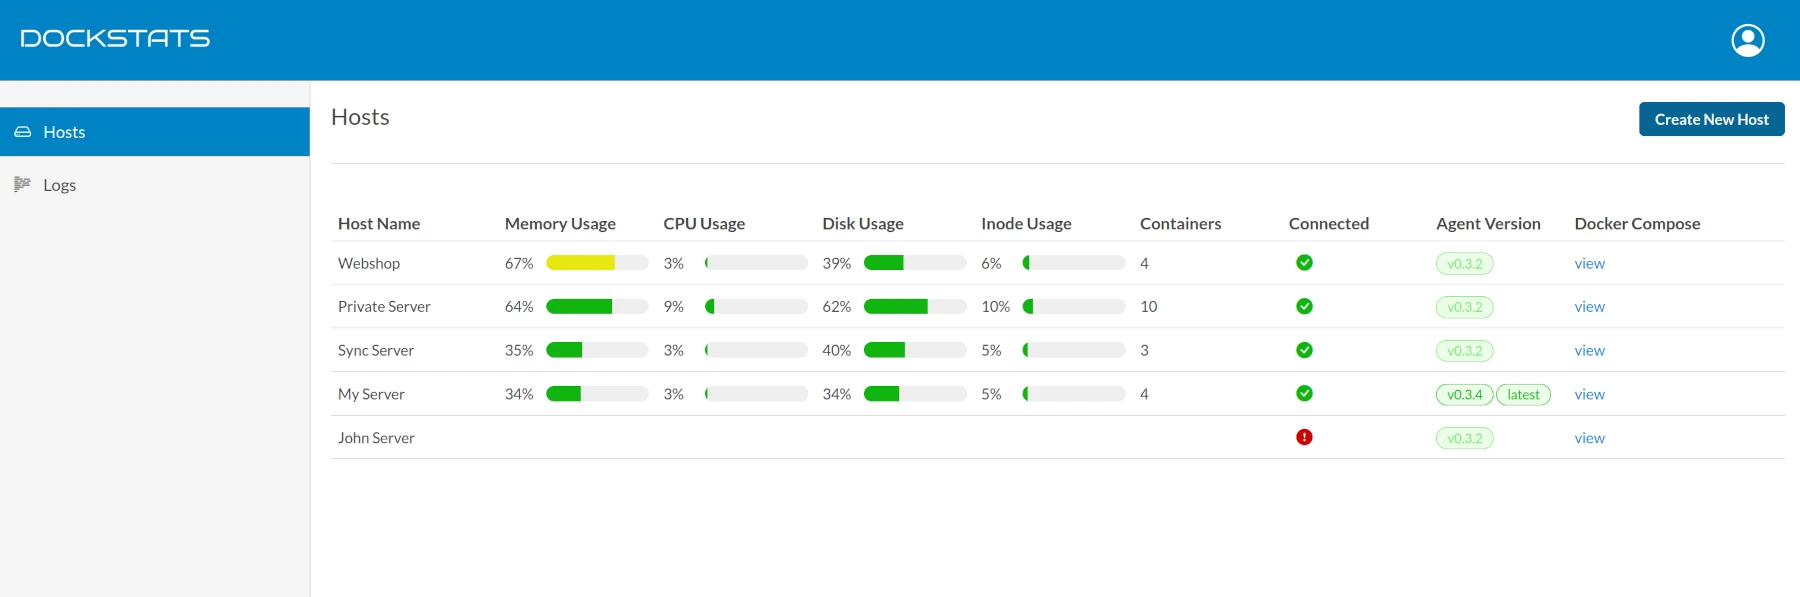
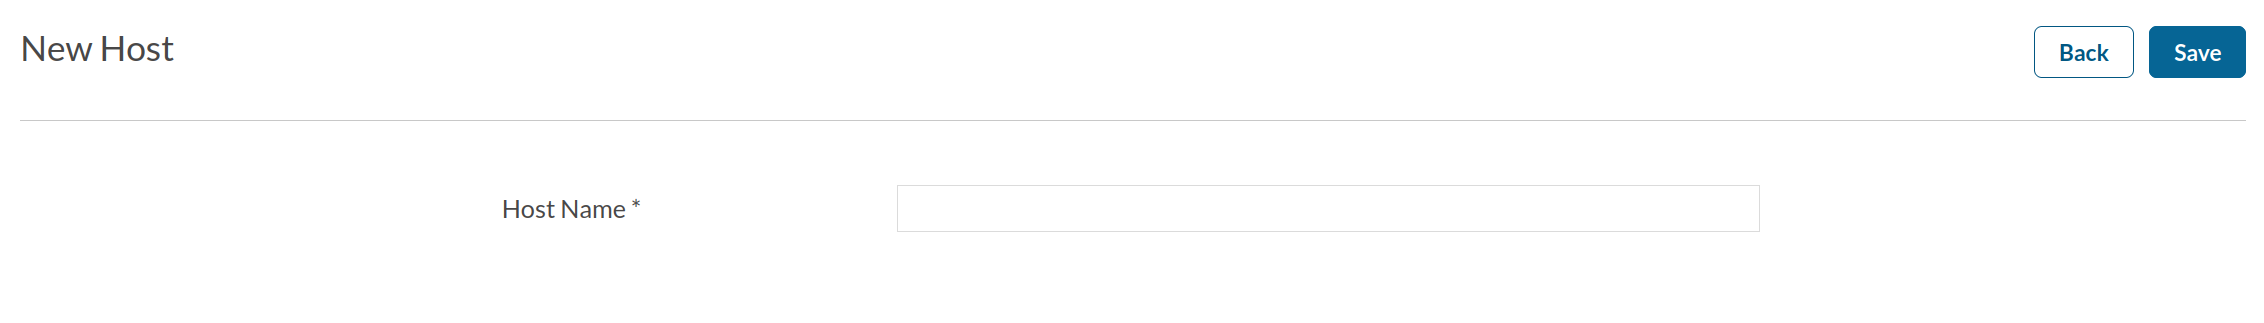
2. Create a Host
In the hosts, create a new Host — this represents one of your servers.
3. Copy Docker Compose File
After creating the host, find it in the table and click on “View” in the Docker Compose column.
Copy the provided docker-compose.yaml configuration.

4. Deploy on Your Server
On your server, create a file named docker-compose.yaml and paste the configuration inside.
Then run:
docker compose up -dThat's it! The agent will automatically collect logs and metrics and send them to DockStats.
Structured Logs & Metadata Mapping
DockStats Hub supports structured logs — for example, JSON-formatted logs. If your logs include the following keys:
level, time, env, app, msg
Everything will be parsed and displayed automatically. Popular loggers like Go's slog already use these keys by default.
If Logs Have Similar Keys (Field Mapping with CONVERTER)
If your logs use different field names (for example, application instead of app, or environment instead of env), you can remap them using the CONVERTER environment variable.
Add this to your docker-compose.yaml:
dockstats-agent:
	environment:
		- CONVERTER="application:app,environment:env"
This will map application to app and environment to env, ensuring your metadata is displayed correctly. Without this, app and env will default to unknown.
If Logs Are Missing Metadata (Injecting Fields with INJECTOR)
If you're running third-party containers (like Redis or NGINX) that don't emit structured logs or don't include fields like env or app, use the INJECTOR environment variable to manually assign metadata based on the container name.
Use the following format:
INJECTOR="container-name:{app:my-app,env:prod},container-name2:{app:my-app2,env:dev}"Example inside your docker-compose.yaml (under the DockStats agent service):
dockstats-agent:
	environment:
		- INJECTOR="redis-container:{app:redis-app,env:prod},nginx-container:{app:web,env:prod}"
In this example, logs from the redis-container will be labeled as redis-app with environment prod, and nginx-container will appear as web in prod.
Self-Hosted DockStats Hub
You can run DockStats Hub locally or on your own infrastructure using Docker Compose. This gives you full control over your data and hosting environment.
Docker Compose Example
The following example runs both the DockStats Hub and a Postgres database:
services:
  dockstats-hub:
    image: krstak21/dockstats-hub:latest
    depends_on:
      postgres:
        condition: service_healthy
      redis:
        condition: service_healthy
    restart: always
    ports:
      - "19001:9191"
    environment:
      - APP_NAME=dockstats-hub
      - APP_ENV=prod
      - APP_BASE_URL=http://localhost
      - APP_PORT=19001
      - DB_USER=postgres
      - DB_PASS=postgres
      - DB_NAME=postgres
      - DB_HOST=postgres
      - DB_PORT=5432
      - REDIS_ADDR=redis:6379
      - CORS_ALLOWED_ORIGINS=http://localhost:19001
      - INIT_USER_EMAIL=test@test.com
      - INIT_USER_PASSWORD=Test.1234
      - LOGS_PER_DAY=100000
      - LOG_RETENTION=60
      - METRIC_RETENTION=60
    networks:
      - dockstats-net
  postgres:
    image: timescale/timescaledb:2.20.2-pg17
    command: postgres -c log_checkpoints=off
    networks:
      - dockstats-net
    healthcheck:
      test: ["CMD-SHELL", "pg_isready -U postgres -d postgres"]
      interval: 5s
      timeout: 5s
      retries: 10
    restart: always
    environment:
      - POSTGRES_USER=postgres
      - POSTGRES_PASSWORD=postgres
      - POSTGRES_DB=postgres
    expose:
      - "5432"
  redis:
    image: redis:8.0.2
    restart: always
    expose:
      - "6379"
    command: ["redis-server", "--save", "60", "1", "--loglevel", "warning"]
    healthcheck:
      test: ["CMD", "redis-cli", "ping"]
      interval: 10s
      timeout: 3s
      retries: 5
    networks:
      - dockstats-net

networks:
  dockstats-net:
    name: dockstats-net
    driver: bridge
Persistent Storage
Important: Make sure to mount a volume for Postgres (./pgdata:/var/lib/postgresql/data) so that logs and metrics are not lost if the container restarts.
Environment Variable Reference
- APP_BASE_URL – Base URL where your Hub will be accessible (e.g.,
http://localhostfor local setup). - APP_PORT – Port the app runs on inside the container (e.g., 19001). Can be changed to
80or443behind a reverse proxy. - CORS_ALLOWED_ORIGINS – Set this to the frontend origin to allow cross-origin requests.
- INIT_USER_EMAIL – Email used to create the initial admin user. Only required during the first startup.
- INIT_USER_PASSWORD – Password for the initial admin user. Also used only during first initialization.
- LOGS_PER_DAY – Maximum number of logs accepted per day (default: 100,000).
- LOG_RETENTION – Log retention duration in days (e.g., 60).
- METRIC_RETENTION – Metric retention duration in days (e.g., 60).
After the initial user is created, you can remove INIT_USER_EMAIL and INIT_USER_PASSWORD from your environment configuration.
Testing Locally: Running Hub and Agent Together Locally
If you'd like to run both the DockStats Hub and the Agent locally in Docker containers for testing, you need to make a few small changes to allow them to communicate with each other.
This is necessary because each container runs in isolation unless explicitly joined to a shared network.
Without this, the Agent won't be able to resolve dockstats-hub as a hostname.
⚠️ The Agent’s docker-compose.yaml file is provided automatically when you create a new Host in the Hub UI.
After creating a host, you can download the YAML file directly from the dashboard.
Changes Required in Agent Docker Compose
- Add shared network definition at the bottom:
networks: dockstats-net: external: true - Attach the Agent service to that network:
services: dockstats-agent: ... networks: - dockstats-net - Update the Hub URL in the environment variables:
DOCKSTATS_HUB_URL: http://dockstats-hub:9191
✅ Full Example (Agent)
services:
  dockstats-agent:
    image: "krstak21/dockstats-agent:v1.0.0"
    container_name: "dockstats-agent"
    restart: unless-stopped
    networks:
      - dockstats-net
    volumes:
      - /var/run/docker.sock:/var/run/docker.sock:ro
    environment:
      APP_NAME: dockstats-agent
      DOCKSTATS_HUB_URL: http://dockstats-hub:9191
      APP_ENV: prod
      IDENTITY_KEY: "key"
      HOST_ID: "host-id"

networks:
  dockstats-net:
    external: true
🧭 Startup Order
- Start the Hub container first.
- Once it's up, start the Agent container.
🟢 Default Behavior (No Changes Needed)
If you're running the Agent on your local machine and connecting to a Hub hosted remotely (e.g., on a server), no changes are needed. The Agent will communicate with the remote Hub using the default configuration and public URL.